“Brexit” Example
The June 23rd, 2016 surprise decision by the United Kingdom to exit the European Union (commonly known as “Brexit”) rattled public markets.
The unprecedented vote precipitated increased market volatility, as investors fled to safe haven assets like US Treasury Bonds and Gold. The most dramatic effects materialized in currency markets, as the British Pound (GBP) fell to its lowest level in more than 30 years against the US Dollar (USD), losing almost 15% of its value in the two weeks following. Such unanticipated shocks pose significant challenges for financial market regulators and chief risk officers and call into question the robustness of algorithmic models to manage portfolio and systemic risk.
A central limitation for regulators and financial institutions alike is the ability to anticipate, identify, and isolate the portfolio, counterparty, and trading effects of exogenous events like “Brexit”. The Columbia University Open Source Risk Engine (CUORE) dashboard provides a solution. The dashboard aggregates exposure metrics like Current Exposure (CE), Effective Expected Positive Exposure (EEPE), and Credit Value Adjustment (CVA) derived from an underlying risk simulation model. The dashboard tells the history and the possible future trajectories (distributions) of the portfolio’s present value (PV), providing forecasts of the distributions of Expected Positive Exposure (EPE), Potential Future Exposure (PFE) and Expected Negative Exposure (ENE), with the ability to drill down to credit ratings, counterparties, netting sets, and even individual contracts.
This example shows that “Brexit” had a dramatic effect on portfolio exposure in US dollar (USD) terms. Due to the currency’s depreciation and increased FX volatilities, exposure metrics like Current Exposure (CE), Effective Expected Positive Exposure (EEPE), and Credit Value Adjustment (CVA) increase substantially in USD.
1. Total Portfolio – Historical Exposure
The analysis builds off of a sample derivatives portfolio comprised of 650 trades across 26 counterparties with randomly generated notionals, tenors, currencies, and reset frequencies – except for counterparties CUST_G and CUST_S (which are entirely comprised of GBP-only trades), and CUST_E (which is entirely comprised of EUR-only trades). Upon landing on the Home screen of the CUORE Risk Dashboard, all tables and metrics are calculated for the total portfolio in USD and aggregated across all trades and counterparties.
It can be seen in the Total Exposure chart that Credit Exposure (CE) for the entire portfolio increases from $68.2MM on June 23, 2016 to $72.0MM on July 6, 2016, exceeding the pre-defined limit threshold of $70MM.
The Risk Dashboard can help users identify the drivers of the increased exposure, and drill-down to deeper levels of granularity to isolate the largest contributors. For example, the BBB credit rating makes up the majority of CVA on July 6, 2016 (21.77%), an indicator of outsized counterparty credit risk. Further, it is the only credit rating to well exceed the pre-defined CE limit threshold ($15.4MM vs. $10MM Limit).
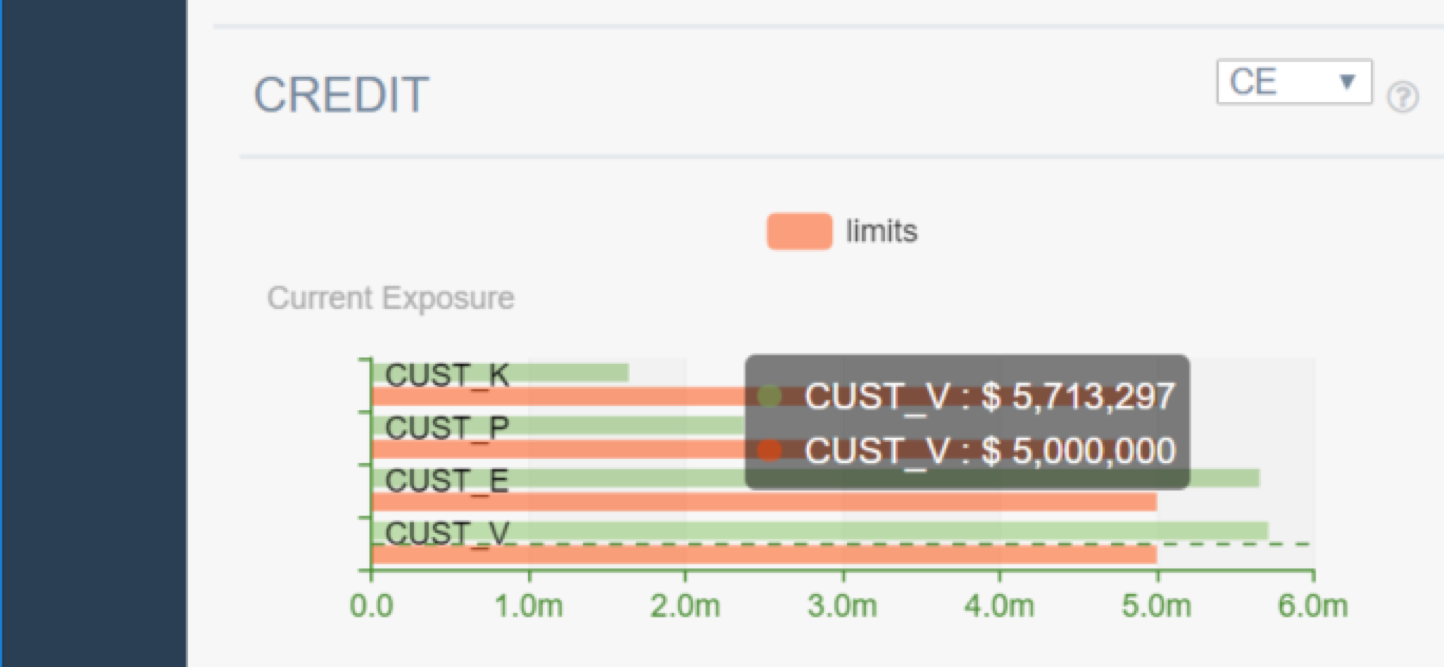
Drilling down into the BBB credit rating, the user discovers that CUST_V and CUST_E make up the majority of CE at $5.71MM and $5.66MM, respectively, each above the $5MM pre-defined limit threshold. Comparing these results to the same charts on June 23, 2016, one day before the “Brexit” vote become public, the user will notice that CUST_V’s CE was only $4.94MM, below the $5MM limit.
This increase of $774K (21% of the $3.7MM total increase) over the two week “Brexit” period represents the most by any single counterparty in the representative portfolio, just ahead of CUST_G (see subsequent examples).
2. Total Portfolio – Exposure Profile and CVA
Exposure increases can be seen in projections of future credit exposure as well, by selecting June 23, 2016 as the business date and comparing peaks in Potential Future Exposure (PFE) and Credit Value Adjustment (CVA) against the same chart for July 6, 2016. Peak PFE increases from $112.9MM to $120.8MM., while CVA increases from $3.01MM to $3.18MM.
3. Total Portfolio – Limit Breaches
Clicking the “Limits” button on the left brings up a Limits Report showing risk metric values for all trades in your portfolio, as well as specific limit breaches in the second tab. By clicking the “Breaches” tab and selecting June 23, 2016 as the date, you can see 43 instances of exposure Consumption Values being greater than the specified Limit Value – compared to 58 instances only two weeks later on July 6, 2016, reflecting generally higher levels of market volatility increasing exposures within the portfolio.
4. GBP Portfolios – CUST_G
Remember that CUST_G and CUST_S are each comprised of GBP-only denominated interest rate swaps, with credit ratings of AAA and CC respectively. Thus, we’d expect more dramatic increases in exposure compared to other portfolio with more diversified currencies.
Indeed, CE for netting set CSA_35 (comprised of 5 GBP-only trades) increases from $816K to $980K over the two-week Brexit period, while peak PFE increases from $1,297K to $1,503K.
CUST_G’s 25 trades (3.8% of 650 total) account for $503K of the $3.8MM increase in CE (14%) from June 23, 2016 to July 6, 2016.
5. GBP Exposure – CUST_S
The increase in exposure as a result of “Brexit” can also be seen within the Risk Gauge, as the percentage of CE limit consumption for CUST_S increases from 76% on June 23 to 83% on July 6.
CUST_S’s 25 trades (3.8% of 650 total) account for $370K of the $3.7MM increase in CE (10%) from June 23 to July 6. In all, the 50 GBP-only trades for CUST_G and CUST_S (8% of 650 total trades) represent nearly 25% of the increase in CE over the 2-week Brexit period from June 23, 2016 to July 6, 2016.
